Running a professional services business means your team's time is your most valuable asset. But if you don't have full visibility into how that time is being spent, it's tough to make the right decisions to improve efficiency and profitability.
That's where understanding resource utilization comes in. It gives you real-time insights into how much of your team's time is spent on billable work versus non-billable tasks. With this data, you can pinpoint who's overworked, who's underutilized, and how these dynamics impact your bottom line.
Whether your goal is to optimize project delivery, reduce burnout, or boost profitability, resource utilization is the tool you need to make it happen. In this post, we'll explore 9 key ways resource utilization can directly contribute to your firm's profitability.
1. Track Resource Utilization in Real-Time
Resource utilization gives you a live look at resource allocation within your organization. You don't have to wait for a weekly report or ask your team to guess how busy they are. The numbers are already there.
You can check capacity by person, team, or role. You'll know if someone is overbooked or has time available next week. You can filter by billable or non-billable hours. You can see what's scheduled and what's actually been logged.
It takes a few seconds to spot gaps or overload. That helps you avoid missed deadlines and unhappy clients.
2. Plan Work Based on Reality, Not Guesswork
Your people don't work 40 billable hours a week. Some are part-time. Some are new. Some are out on vacation. Resource utilization takes all that into account.
It looks at each person's true availability. Then it compares how many hours they're scheduled for vs. how many they've logged. That shows you how close you are to your billable targets - and if you're going to hit them.
If someone is underutilized, you can give them more work. If they're at capacity, you can reassign tasks. It's complete visibility, not a guessing game.
3. Keep the Focus on Revenue-Generating Work
Not all work makes money. Having complete visibility into resource utilization helps you see the difference.
You can filter by billable and non-billable time. That lets you track how much of your team's effort goes toward the project delivery versus internal tasks like meetings or admin.
This helps you stay on target. You'll know if too much time is spent on work that doesn't bring in revenue. And you'll spot if someone's doing too much support work instead of project delivery.
The goal is to focus on the work that pays the bills and to showcase value-add efforts when applicable. Detailed resource utilization reporting helps you do that.
<10-profitability-essentials>
4. Adjust Quickly When Things Change
Workloads shift. Priorities change. Scope creeps. If you wait too long to adjust, you're already behind.
Resource utilization insights show you the current state. If someone is about to hit their limit, you'll know. If someone has time next week, you'll see that too.
This lets you move work around before problems start. You don't have to wait until the end of the week to realize a project's off track. You can fix it today before it even becomes a problem.
The faster you react, the more stable your operations stay.
5. Get the Detail You Need - Without the Clutter
Different roles need different views. You might want to look at an individual's hours. A director might want to see the whole department.
A good resource utilization view lets you filter by role, office, team, or skill set. You can break it down however you need. You can also click into the data to see where the hours came from - project work, meetings, support tickets, etc.
This gives you control. You don't need to open five tools or run six reports. Everything is in one place.
6. Spot Patterns and Plan Ahead
Looking ahead matters just as much as knowing what's happening now. Resource utilization shows both.
You can view past trends to understand how things usually go - who tends to be overbooked, what times of year are slower, and how long similar projects have taken. That helps you build better plans.
You can also forecast based on what's already scheduled. If someone has too many hours booked for next month, you'll see it now. If you need to hire soon, the data will show that too.
This makes future planning more accurate. No surprises. No scrambling.
7. Connect Time to Profit
Tracking utilization on its own doesn't give you the full picture. You need to know how time spent affects revenue and margins.
A resource utilization tool connected to your billing and budget data creates visibility throughout the quote-to-cash lifecycle. You can see how much time went into a project, how much you billed for it, and what your profit was.
If your team is logging more hours than expected, you'll know. If a project goes over budget because of unplanned time, you'll see that too.
This helps you catch overservicing early. It also helps you quote more accurately in the future.
8. Build Trust and Accountability
When your team can see their own utilization, they understand how their work fits into the bigger picture. It's not about micromanaging. It's about clarity.
This makes it easier for people to stay on track. It helps managers set fair expectations. It also gives leadership a clear view of what's going on without needing constant updates.
Everyone's working from the same data. That builds trust and reduces confusion.
9. Use Accelo To See the Whole Picture Without the Headache
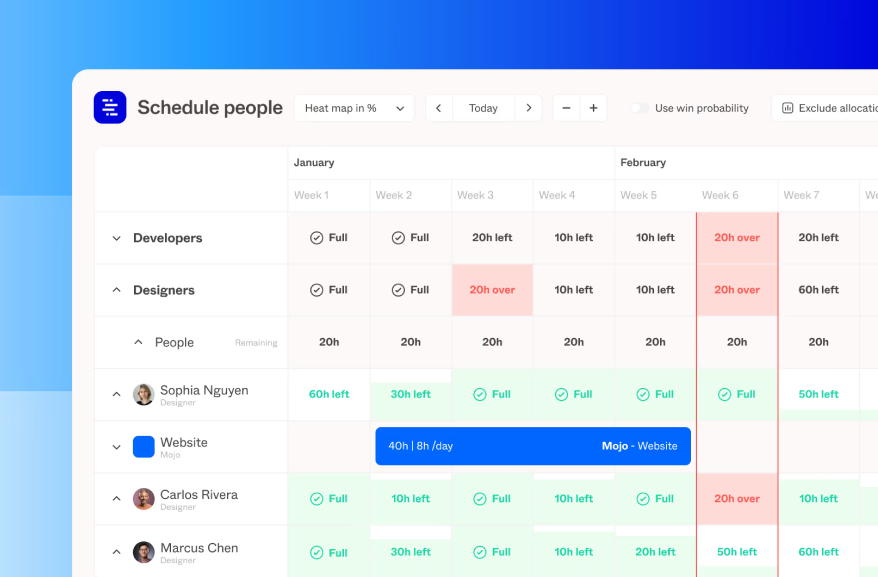
Most tools give you a partial view. Accelo connects everything.
Its resource utilization view pulls in real-time data from schedules, time logs, project plans, and budgets - all in one place. That means no spreadsheets, no disconnected tools, and no manual reporting.
Here's what you can do with it:
- See real-time resource utilization by person, team, role, or department
- Compare scheduled vs. actual hours to stay on top of delivery
- Filter by billable vs. non-billable time to keep work revenue-focused
- Drill down into time entries from any project, ticket, or retainer
- Forecast future availability and hiring needs based on current workload
- Connect time directly to budgets and billing to understand profitability
Accelo gives you clarity without the clutter. It updates automatically, so you're never working with old numbers. And because everything's connected - time, projects, budgets, and people - you're always working with the full picture.
If you're running a team that needs to deliver work on time and on budget, this kind of visibility isn't a luxury. It's a requirement.
Final Thoughts
You don't need a hundred spreadsheets or daily check-ins to understand how your team is doing. You just need a clear view of how they're spending their time.
That's what complete visibility into resource utilization gives you.
It helps you manage workloads, reduce burnout, and deliver profitable projects. It makes your business easier to run. And it gives your team the support they need to do their best work.
Want a better way to track your team's time and stay profitable? See how Accelo's resource utilization view works in a real-world setting. Book a demo with an expert to see it in action.
READ NEXT: The 5 Best Accounting CRMs for CPA Firms


.svg)