Key Takeaways
- To calculate project profitability, subtract total project costs from project revenue. Divide the resulting profit by project revenue and multiply by 100 to calculate project profit margin.
- Decide which revenue and cost definitions you are using before comparing projects. Booked, billed, recognized, and collected revenue answer different questions.
- Labor cost should reflect the firm's actual costing method, not salary alone. Payroll taxes, benefits, and other employment costs can materially change delivery economics.
- Avoid double-counting costs. If your loaded labor rate already includes payroll burden, do not add the same costs again through overhead allocation.
- Fixed-fee, time-and-materials, and retainer projects use the same basic profitability math, but each model creates different pricing, scope, and revenue risks.
- Profit margin is usually the clearest project-level comparison metric. ROI and realization add context when you are evaluating investment, pricing, write-downs, or unbilled work.
- Forecast project profitability throughout delivery so you can address margin pressure before the project closes.
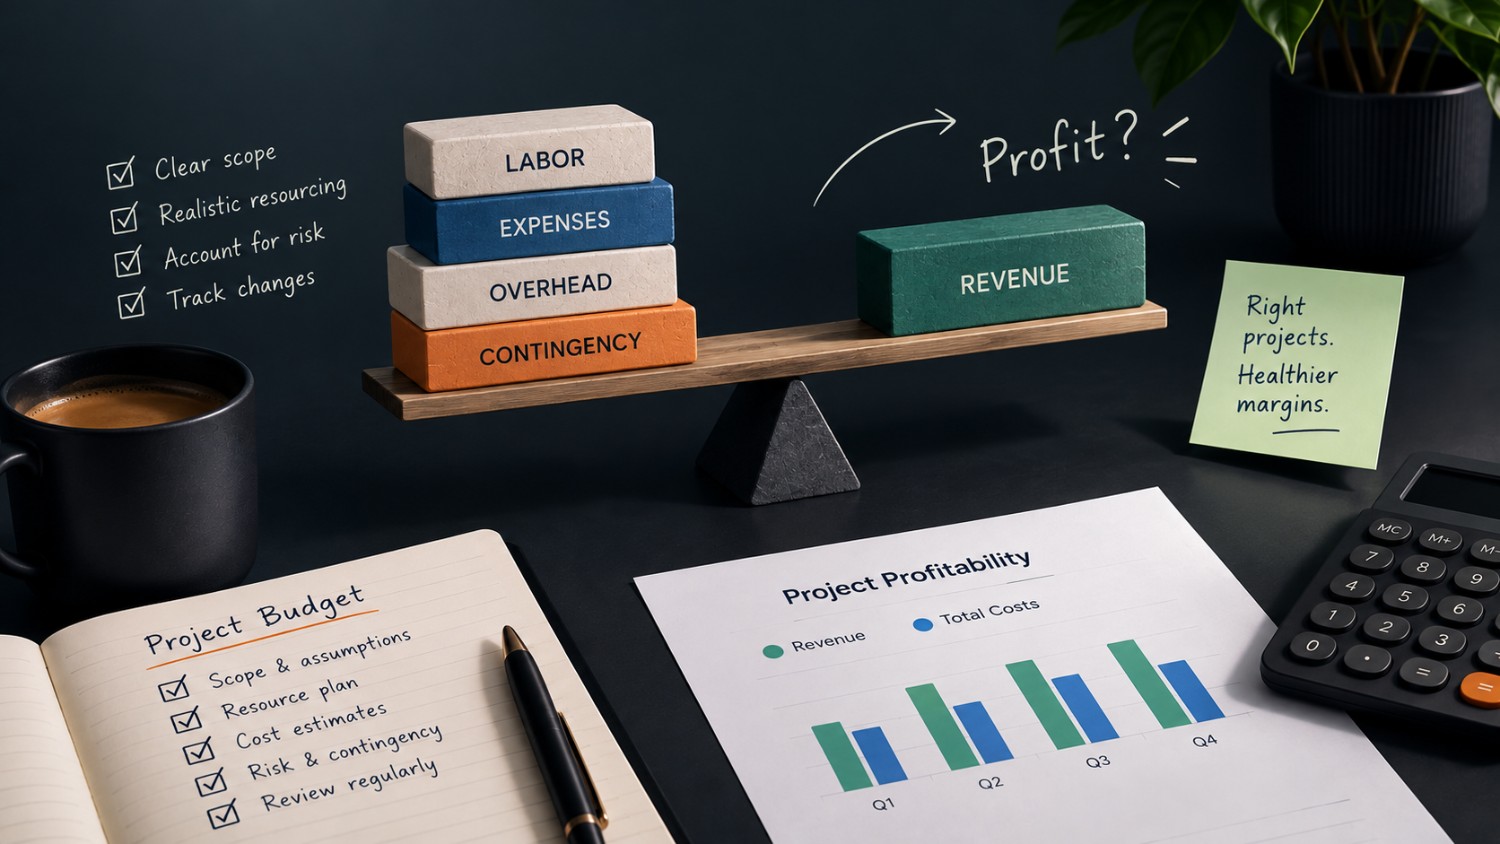
Project profitability measures the profit generated by an engagement after the costs of delivering it are deducted from project revenue. To calculate project profitability, subtract total project costs from project revenue:
Project profit = Project revenue - Total project costs
Then calculate the margin:
Project profit margin = Project profit ÷ Project revenue × 100
If a project generates $100,000 in revenue and costs $70,000 to deliver, it produces $30,000 in project profit and a 30% margin.
The formulas are simple. The judgment lies in deciding which revenue to include, how to calculate labor cost, which delivery expenses belong to the project, and how to treat overhead. Inconsistent definitions can produce materially different answers for the same engagement.
A project’s margin will vary depending on whether the calculation uses booked or recognized revenue, salary or loaded labor cost, and whether it includes project management, rework, and indirect costs. Project profitability therefore belongs within the broader discipline of project accounting, where revenue and cost can be traced back to the work that produced them.
Gather the Inputs Before You Calculate
A profitability calculation is only as reliable as its inputs. Before applying the formula, decide which revenue basis you are using, which labor cost rate applies, which direct expenses belong to the project, and whether the reported margin includes allocated indirect costs.
If those rules vary from one project to another, the percentages may look comparable while measuring different things.
Choose the right project revenue basis.
“Project revenue” can mean several things depending on where the engagement is in its lifecycle.
Booked contract value tells you what was sold. Billed revenue tells you what has been invoiced. Collected revenue tells you what the client has paid. Recognized or earned revenue reflects what the firm considers earned under its accounting policy.
Those figures can differ significantly while work is still underway.
Suppose a six-month fixed-fee project is worth $180,000 and the team is halfway through delivery. Comparing the full $180,000 contract value with only three months of incurred cost would make current profitability look stronger than it really is.
For active project reviews, use the revenue basis your finance team has defined for that purpose and label it clearly. Approved change orders, credits, write-downs, and other revenue adjustments should follow the same reporting policy.
Scope changes deserve particular attention because they can change both revenue and delivery cost. Accelo's guidance on change order management goes deeper into reflecting changes in scope, fees, timelines, resources, and approvals in the project financials instead of absorbing extra work into the original budget.
Use the full cost of labor.
Labor is usually the largest delivery cost in professional services, which makes the cost rate behind each hour especially important.
Converting salary to an hourly figure does not necessarily reflect the full cost of employing someone. Payroll taxes, health benefits, retirement contributions, insurance, paid leave, and other employment costs may fall outside base pay.
The Bureau of Labor Statistics Employer Costs for Employee Compensation tracks wages, benefits, and total employer compensation separately, which illustrates why an employee's wage rate and the firm's cost of employing that person are not the same number.
Your finance team may maintain a loaded labor rate by individual, role, or department. A simple structure might be:
Loaded hourly cost = Annual employment cost ÷ Productive hours
The exact calculation varies by firm, but the finance-approved costing method should be applied consistently.
How those hours are used also affects project economics. Our guide to calculating resource and billable utilization provides the related utilization formulas when you need to understand how much available employee capacity translates into client work.
Include direct project expenses.
Include expenses directly attributable to the project.
Depending on the engagement, those may include subcontractors, specialists, travel, project-specific software, production costs, materials, research, or other third-party expenses.
Reimbursable costs deserve particular attention.
If the firm spends $5,000 on client travel and invoices that same $5,000 back to the client, including the reimbursed revenue while leaving the expense out of the cost base will inflate the project result.
Some firms include both the revenue and expense. Others exclude both from an internal profitability view because they treat the activity as pass-through. Either approach can work if the reporting rule is explicit and applied consistently.
Decide how indirect costs and overhead are treated.
Direct project margin and a margin that includes allocated indirect costs answer different questions.
A project may look highly profitable after direct labor and project expenses while contributing less once indirect labor, finance, HR, software, facilities, and other shared operating costs are considered.
Professional services firms use several approaches to allocate those costs, including an overhead multiplier on direct labor, a fixed hourly burden rate, a percentage of labor cost, or a departmental cost pool.
Whatever method your firm uses, avoid counting the same cost twice. If payroll taxes and benefits are already included in the loaded labor rate, don't add them again through the overhead allocation.
Those assumptions should also be reflected in the project budget, not introduced only during profitability reporting. If you are revisiting that process, our project budgeting software guide explains how budgets, resource costs, actuals, and forecasts fit together.
How to Calculate Project Profitability in Four Steps
Use the same calculation sequence across projects so operations and finance can compare results without first reconciling different methodologies.
Step 1: Confirm the revenue included in the calculation.
Start with the revenue basis chosen for the report.
For a completed fixed-fee project, this may be final recognized revenue after approved changes, credits, and other adjustments. For time-and-materials work, it may be approved billable hours multiplied by the applicable bill rates, less write-downs or credits.
For an active project, use the firm's agreed earned or recognized revenue measure rather than comparing the full contract value with partial costs.
Label the number clearly. “Revenue” is too broad if the reader cannot tell whether it means booked, billed, collected, or recognized revenue.
Step 2: Calculate the direct project costs.
Calculate labor using the firm's approved project cost rates, then add project-specific expenses.
If the team logged 800 hours at an average loaded labor cost of $75 per hour:
Direct labor cost = 800 × $75 = $60,000
Add subcontractors, travel, software, materials, and other direct expenses for the engagement.
Include project-specific non-billable work as well. Project management, internal review, QA, client follow-up, and rework still consume delivery capacity even when the client does not see a separate billable line for them.
Leaving those hours outside the cost calculation can make projects that require heavy internal support look more profitable than they are.
Step 3: Apply the agreed indirect cost allocation.
If your project profitability measure includes indirect costs or overhead, apply the firm's normal methodology.
Suppose the firm allocates indirect costs at 15% of direct labor:
Allocated indirect cost = $60,000 × 15% = $9,000
The 15% is illustrative, not a benchmark for professional services.
Use an allocation that reflects the firm’s cost structure and accounts for what is already included in the loaded labor rate. A stable methodology makes margins meaningfully comparable across projects.
Step 4: Calculate and label the result.
Once revenue and all included costs are available, apply the formulas from the introduction and record both profit dollars and profit margin.
If project revenue is $120,000 and total included cost is $83,000, the project produces:
Project profit: $37,000
Project profit margin: 30.8%
The label matters here.
If the $83,000 includes allocated indirect costs, say so. If the calculation includes only direct delivery costs, call it a direct or gross project margin, depending on your firm's terminology.
A percentage without a defined cost base is difficult to interpret and even harder to compare.
Worked Project Profitability Example
Assume a consulting firm completes a fixed-fee engagement for $120,000.
The team records 800 project hours at an average loaded labor cost of $75 per hour. The engagement also requires $8,000 of subcontractor support and $6,000 in software and travel. Under the firm's internal project-reporting methodology, it allocates an additional 15% of direct labor to indirect costs.
Before the $9,000 indirect-cost allocation, profit against the direct project cost base is $46,000, or a 38.3% margin.
After the allocation, reported profit falls to $37,000 and margin to 30.8%.
Each percentage answers a different question. Direct margin isolates the economics of delivery, while fully allocated project margin accounts for the firm’s chosen indirect-cost allocation. Comparisons become misleading when a report switches between the two definitions without identifying the cost base.
See how time-and-materials changes the commercial risk.
The profitability formula does not change for a time-and-materials project, but revenue depends on how much of the recorded work can ultimately be billed.
Suppose the same team records 800 hours at an average bill rate of $150. That creates $120,000 of potential billable value.
If 60 hours are later written off and the client is billed for only 740 hours:
Revenue = 740 × $150 = $111,000
If total delivery cost remains $83,000:
Project profit = $28,000
Profit margin = 25.2%
Delivery cost has not changed, but billed revenue has decreased.
Weak fixed-fee profitability often points toward estimating, scope, or resource mix. Time-and-materials projects can experience the same problems, but write-downs, unapproved work, rate realization, and incomplete billing may also reduce margin.
Calculate project profitability in Excel.
A spreadsheet can handle the calculation when the project list is manageable, and the underlying inputs remain current.
Format margin, ROI, and realization as percentages.
The Excel formulas are not complex. The more difficult operating problem is keeping time, cost, scope changes, write-downs, expenses, and revenue current enough that the result still reflects the project the team is managing.
How Profit Margin Differs From ROI and Realization
Profit margin is usually the clearest starting point for project delivery because it shows what portion of project revenue remains after the costs included in the calculation.
ROI and realization answer different questions, so they are more useful as supporting measures than replacements for project margin. For a broader view of how margin, realization, utilization, revenue leakage, and other operating measures fit together, professional services KPIs connect those metrics across demand, capacity, delivery, and financial performance.
Use ROI when cost is the comparison point.
ROI compares project profit with the cost required to generate it:
ROI = Project profit ÷ Project cost × 100
Using the fixed-fee example:
$37,000 ÷ $83,000 × 100 = 44.6% ROI
That percentage is higher than the 30.8% project margin because the denominator is different.
Margin asks how much of the revenue became profit. ROI asks what return the firm generated relative to the amount invested in delivering the project.
For routine delivery reviews, margin is usually easier to compare across engagements. ROI can be more useful when leadership is deciding where to invest money, capacity, or specialist resources.
Use realization to see how much expected value became revenue.
Realization measures how much of the standard or expected billable value of the work was ultimately captured as revenue.
A simplified formula is:
Realization = Actual billed or recognized revenue ÷ Standard value of work × 100
Suppose recorded work has a standard billable value of $100,000, but only $85,000 becomes revenue after discounts and write-downs.
Realization is 85%.
Professional services firms define realization differently, particularly around whether the numerator uses billed, recognized, or collected revenue. Agree on the methodology before comparing people, teams, or projects.
Low realization can help explain weak profitability even when the team looks busy. High utilization does not protect margin if work is being written down, delivered outside scope, or completed without corresponding revenue.
Treat profitability index as a different financial measure.
The profitability index is typically calculated as:
Profitability index = Present value of future cash flows ÷ Initial investment
It is primarily a capital-budgeting measure for comparing investment opportunities when the timing of future cash flows matters.
For routine professional services project management, profit dollars, margin, and realization are generally much more actionable.
If the question is whether an active consulting, agency, engineering, or IT services engagement is meeting its financial targets, project margin provides the more direct answer.
How to Interpret Project Profitability
A project margin should lead to a decision or a more focused investigation.
An engagement delivering a 24% margin instead of the expected 32% signals a meaningful variance, but the percentage alone does not reveal its cause. Understanding the result requires linking the financial variance to how the work was sold, staffed, and delivered.
Compare margin percentage with total profit contribution.
High margin and high profit dollars are not the same thing.
A $10,000 project at a 50% margin contributes $5,000 of profit. A $200,000 engagement at a 25% margin contributes $50,000.
The smaller engagement is more profitable as a percentage of revenue. The larger engagement contributes substantially more profit dollars.
Looking at both prevents two common mistakes: favoring small high-margin work that cannot materially support the business, or accepting weak-margin large engagements simply because the absolute profit number looks substantial.
The relationship between utilization and margin can also be less direct than it first appears. Accelo's analysis of the utilization paradox looks at why professional services project margins increased even as industry billable utilization declined, reinforcing the need to read utilization alongside pricing, labor cost, project mix, and realization.
Comparing profitability across projects, clients, services, and engagement models helps you determine whether a margin pattern is isolated or systemic. Accelo’s AI-powered project performance metrics support that portfolio-level analysis.
Look for the delivery decision behind the number.
Suppose two comparable projects were sold at the same target margin, but one finishes ten percentage points lower.
The useful questions are operational.
Did more senior people perform work that was priced for a lower-cost role? Did the client require more review cycles? Did scope expand without a corresponding fee or timeline adjustment? Was the original estimate too lean? Did the project absorb more PM, QA, or rework than expected? Were billable hours written down?
Margin tells you where to investigate. The project data tells you what should change next time.
Resource planning is often part of that diagnosis. A staffing decision changes cost and capacity, and resource forecasting and planning explain how future project demand, roles, skills, availability, and margin context affect staffing decisions before a constraint becomes immediate.
Keep profitability and cash flow separate.
A profitable project can still create cash pressure when invoicing or collection is delayed.
A project can also collect a large deposit upfront and later lose money because delivery costs exceed the estimate.
Cash flow and profitability belong in the same operating conversation, but they answer different questions.
Profitability tells you whether the work makes money under the firm's cost model. Cash flow tells you when the money comes in and goes out.
Conflating the two can hide both project risk and working-capital risk.
Forecast Project Profitability While Work Is Still Active
A closeout margin records the final result. Forecasted profitability shows where the margin is heading while you can still adjust staffing, scope, timing, and external spend.
Re-estimate what the remaining work will cost.
Suppose an engagement has generated $90,000 of recognized revenue and incurred $63,000 of cost so far.
The current margin is 30%.
That result looks healthy until the team updates the forecast and realizes the remaining work will cost $25,000 more than originally expected.
The unused portion of the initial budget is no longer a credible estimate of the cost to finish.
For an active project, forecast profitability can be calculated as:
Forecast project profit = Expected final revenue - Expected final project cost
Forecast margin = Forecast project profit ÷ Expected final revenue × 100
If expected final revenue is $150,000 and the latest expected final cost is $115,000:
Forecast profit = $35,000
Forecast margin = 23.3%
If the project was priced at a 35% margin, investigate the gap while changes are still possible.
Keep time and cost data current.
Forecasted profitability is only useful when the inputs are current.
If two consultants have not logged the week's work, project cost is understated. If an expense has not been assigned to the engagement, margin looks healthier than it is. If a change order has been approved but has not reached the financial model, expected revenue may be understated.
Use AI to support project profitability forecasting.
AI can monitor time, cost, budget, and delivery data, flagging missing time entries, inconsistent project data, rising delivery costs, or a declining forecast margin.
Earlier warnings give you more time to investigate the cause and decide whether to adjust staffing, revisit scope, update the forecast, or accept a lower margin.
Common Project Profitability Calculation Mistakes
When a project margin looks unexpectedly high or low, check the underlying inputs before deciding what the result means.
Common calculation problems include:
- Using salary or wage rate when the firm's reporting method calls for loaded labor cost.
- Double-counting benefits or payroll burden across loaded labor and overhead.
- Excluding project management, QA, rework, or other project-specific non-billable effort.
- Comparing full booked contract value with partial delivery costs.
- Treating booked, billed, collected, and recognized revenue as interchangeable.
- Leaving subcontractors, travel, software, or other direct expenses outside the cost base.
- Including reimbursable revenue without the matching reimbursable expense.
- Applying inconsistent overhead rules across projects.
- Ignoring approved scope or pricing changes.
- Comparing different billing models without considering realization and revenue timing.
- Waiting until project close to calculate profitability.
The best model is not necessarily the most complicated one.
A simpler cost methodology applied consistently across the portfolio usually produces more useful comparisons than a highly detailed model whose assumptions change from project to project.
Project Profitability Should Change a Decision
Project profitability earns its place in an operating review when a variance leads to action. A project delivering a 28% margin instead of the 35% expected at kickoff should prompt the team to determine what changed and whether the same pattern is appearing elsewhere.
If senior resources repeatedly perform work priced for more junior roles, future staffing or estimates may need to change. If high-utilization teams consistently show weak realization, review write-downs, approval processes, and scope control. If a service line requires significantly more non-billable project management than the pricing model assumes, future proposals should account for it.
Margin forecasts give the team an opportunity to address declining profitability before the project closes. When margin begins to decline, the project team can still evaluate staffing, external spend, timing, scope, or a pricing discussion with the client. After the engagement closes, the team can learn from the final margin but can no longer change it.
Making those decisions requires more than a margin percentage. Executive teams need to see how recorded time, staffing changes, scope, project costs, and billing affected the forecast, and whether similar patterns are appearing across other projects.
Accelo brings that information together so professional services teams can monitor profitability during delivery, investigate margin variances, and compare performance across the portfolio without manually compiling data from separate systems. Book a Demo to see how Accelo connects project costs, time, billing, and margin visibility throughout delivery.
Frequently Asked Questions
What is the formula for project profitability?
Project profit equals project revenue minus total project costs. The result is the dollar profit the project generates.
How do you calculate project profit percentage?
Subtract total project costs from project revenue, divide the resulting profit by project revenue, and multiply by 100. For example, $30,000 profit on $100,000 revenue produces a 30% project profit margin.
How do you calculate a 75% profit margin?
A 75% margin means profit equals 75% of revenue. If project revenue is $100,000, profit is $75,000 and total project cost is $25,000.
What costs should be included when calculating project profitability?
Include the costs required by your firm's chosen margin definition. These commonly include direct labor, subcontractors, project-specific expenses, and, when calculating a fully allocated project margin, indirect costs or overhead.
What is the difference between project margin and ROI?
Project margin divides profit by revenue. ROI divides profit by project cost or investment. Margin shows what share of revenue became profit, while ROI shows the return generated relative to the amount invested.
What is realization in professional services?
Realization compares the revenue ultimately captured with the standard or expected billable value of the work. Firms calculate it differently, so define whether the numerator uses billed, recognized, or another revenue measure before comparing projects.
How often should a professional services firm calculate project profitability?
Review actual and forecast profitability while the project is active and again at close. The exact cadence depends on project length and risk, but update the calculation often enough to influence staffing, scope, billing, and delivery decisions.




.svg)



.svg)