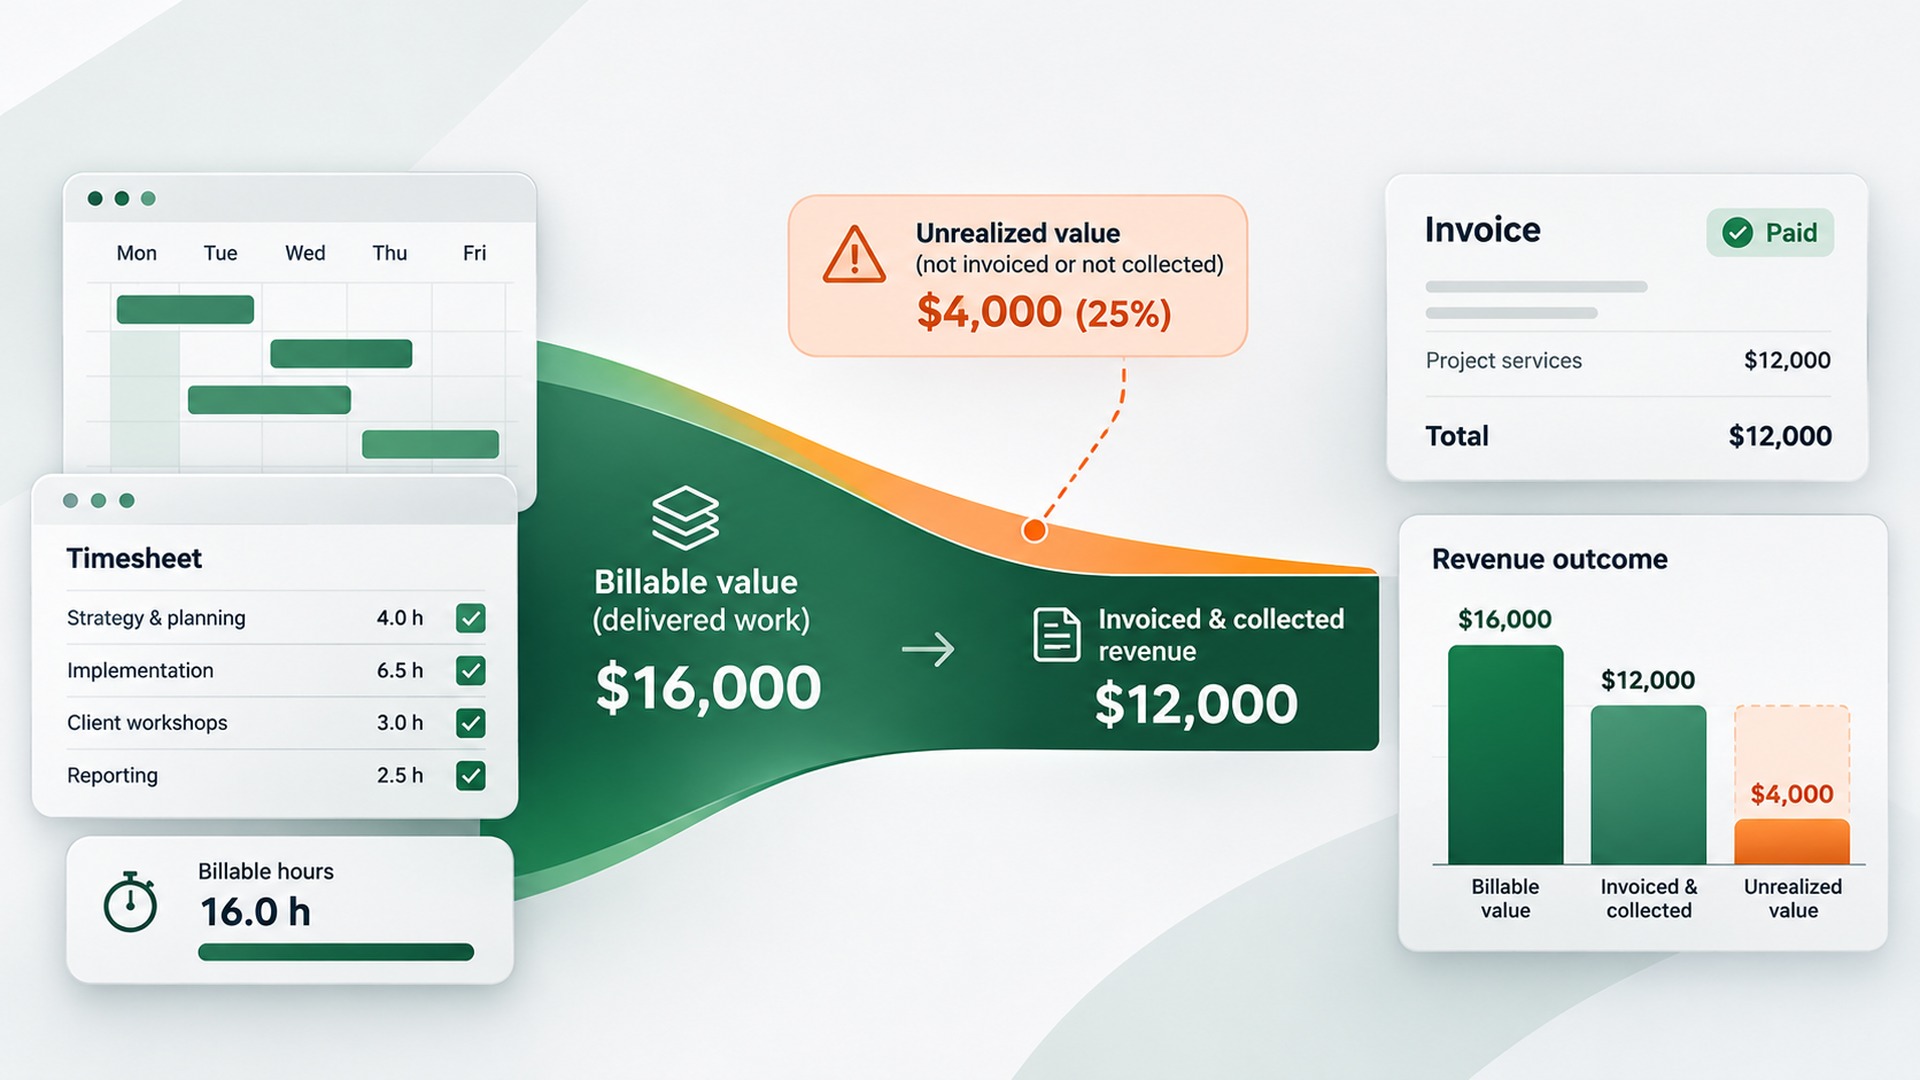
A professional services organization can hit its utilization targets and still generate considerably less revenue than expected.
Employees are busy delivering client work. Billable hours are being recorded. Projects appear productive. But when invoices are prepared, the value of that work may look very different.
Hours are written down. Scope changes go unbilled. Contracted rates differ from standard rates. Fixed-fee projects require more effort than originally estimated.
Realization rate measures how much of the expected billable value of professional services work is invoiced or collected.
For CFOs, COOs, and delivery leaders, the metric helps explain why productive teams don't always generate the expected financial return. More importantly, understanding where and why realization changes can improve decisions about pricing, scope, staffing, and project profitability.
Key Takeaways
- Realization rate measures revenue conversion, not productivity. It shows how much of the expected value of billable work reaches invoices or is ultimately collected.
- Billing and collection realization measure different outcomes. Separating them helps distinguish pricing and delivery issues from payment shortfalls.
- High utilization doesn't guarantee strong realization. Teams may be fully occupied while absorbing unapproved scope, writing down hours, or delivering fixed-fee work beyond estimated effort.
- Evaluate realization alongside project margin. Strong realization does not guarantee profitability when labor costs, resource mix, or delivery effort exceed expectations.
- Fixed-fee projects and retainers require additional context. A realization percentage alone cannot explain whether contracted revenue adequately covers delivery costs.
- The greatest value comes from identifying realization risk before invoicing. Connecting time capture, project forecasts, contract terms, and billing decisions helps leaders address financial problems while they can still influence the outcome.
What Is Realization Rate in Professional Services?
Realization rate measures the percentage of the expected billable value of professional services work that is actually invoiced or collected.
Consulting firms, accounting practices, law firms, engineering firms, and other organizations that generate revenue through professional expertise commonly use realization rates as a financial performance metric.
The basic billing realization formula is:
Billing realization rate = Invoiced revenue ÷ Standard billable value × 100
Standard billable value is calculated from recorded billable hours and their applicable reference billing rates.
For example, if a consulting team records $100,000 of work at standard billing rates but invoices $90,000, its billing realization rate is 90%.
The remaining $10,000 represents a difference between the standard value of the work and the amount invoiced. It may reflect negotiated discounts, project write-downs, absorbed scope, or billing omissions.
Not every difference represents lost revenue. Some adjustments are deliberate pricing decisions, while others indicate problems with delivery or financial controls.
Realization analysis determines which differences are intentional, which are avoidable, and which indicate that an engagement is becoming less financially attractive than expected.
How to Calculate Billing, Collection, and Overall Realization
Professional services organizations typically distinguish between three realization measurements, each representing a different stage in converting billable work into cash.
These calculations should use consistent populations and periods.
For example, invoices issued in one month should not automatically be compared with payments received during that same month. Those payments may relate to earlier invoices.
For collection realization, a more reliable approach is to follow a defined population of invoices through their eventual collection outcome. Collection realization differs from accounting revenue recognition, which depends on applicable accounting standards and contractual obligations.
Realization Rate Calculation Example
Consider a professional services practice with the following performance:
The resulting calculations are:
Billable utilization
2,400 ÷ 3,200 × 100 = 75%
Billing realization
$432,000 ÷ $480,000 × 100 = 90%
Collection realization
$410,400 ÷ $432,000 × 100 = 95%
Overall realization
$410,400 ÷ $480,000 × 100 = 85.5%
The practice achieved 75% billable utilization, but ultimately collected only 85.5% of the standard value of its recorded billable work.
Those results point to different management questions.
Utilization indicates how effectively available capacity was assigned to billable work. Billing realization indicates how much of that work's reference value made it into invoices. Collection realization shows how much of the invoiced amount was recovered.
Examples are illustrative and assume collections relate to the same invoice population. In practice, calculate standard billable value using applicable employee, role, or engagement rates rather than a single blended rate.
How Is Realization Rate Different From Utilization Rate?
Utilization measures how much available capacity is spent on billable work. Realization measures how much of that work's expected value becomes invoiced or collected revenue.
Both are important professional services KPIs, but they diagnose different financial and operational conditions.
Consider two consulting practices with identical capacity, billable hours, and standard billing rates. Both record $1.2 million in billable work, but their billing realization differs:
Practice B invoices $144,000 less than Practice A despite recording the same standard billable value.
That difference is financially significant, but it does not establish why Practice B's realization is lower.
The practice may have negotiated more favorable rates for clients, absorbed additional scope, experienced more project overruns, or written down time that could not reasonably be billed.
The appropriate response depends on which explanation is correct.
Increasing utilization would not necessarily improve the outcome. If the underlying problem is excessive delivery effort on fixed-fee engagements, assigning additional billable work could compound the financial risk.
What Causes Realization Rates to Decline?
Realization typically declines because of pricing decisions, delivery conditions, billing adjustments, or collection shortfalls. Each requires a different management response.
The distinction between intentional and avoidable differences is essential.
A negotiated discount may support a long-term client relationship while still meeting the organization's margin requirements.
A write-down caused by rework or poor estimating is different. It may indicate that the engagement is consuming more delivery capacity than its fee can support.
RELATED: Are You as Good at Forecasting Capacity as You Think You Are?
Why should leaders monitor write-downs?
Individual write-downs may be appropriate, particularly when additional effort results from an internal delivery error. However, repeated write-downs should not disappear into routine invoice approvals.
Patterns across projects, clients, and practices can reveal persistent problems with estimating, quality, scope, or staffing. If one practice repeatedly writes down specialist hours on fixed-fee engagements, leadership should investigate whether the original estimates reflect the skills and effort actually required.
This is where realization analysis becomes more useful than simply comparing invoiced amounts to recorded hours, as it can reveal structural problems in how work is priced and delivered.
What Is a Good Realization Rate?
No universal realization-rate target fits every professional services organization. An appropriate target depends on contract structure, pricing strategy, service mix, and the calculation methodology.
Industry benchmarks can provide context, but comparisons require care.
For example, Clio's 2026 legal-industry benchmark data reports average realization of 90% and collection of 92% among law firms.
These are legal-industry figures, not targets that should automatically be applied to consulting, IT services, or other professional services organizations. An hourly consulting practice may have different realization expectations from a professional services organization delivering complex fixed-fee transformations.
Rather than applying a universal target, leadership should compare realization across similar contract types, practices, and client relationships.
Historical trends can be especially valuable because they show whether changes in realization are tied to pricing, service mix, or delivery performance.
A declining rate is not necessarily a problem if it reflects an intentional pricing change that still produces an acceptable margin. Conversely, a stable rate can conceal deteriorating profitability if delivery costs are rising.
How to Measure Realization on Fixed-Fee Projects and Retainers
For fixed-fee and retainer engagements, interpret realization alongside contracted revenue, actual delivery effort, and forecast margin.
Unlike time-and-materials work, fixed-fee engagements do not necessarily generate additional billable revenue when employees record more hours.
Consider a project with an agreed fee of $100,000:
If the team records work with a standard value of $110,000, realization against standard value is:
$100,000 ÷ $110,000 × 100 = 90.9%
If the project instead requires only $90,000 of standard-rate effort, realization becomes:
$100,000 ÷ $90,000 × 100 = 111.1%
Both calculations may be valid, as long as you compare the fee and recorded work consistently.
But neither establishes the project's profitability.
A project delivered with fewer hours may still produce disappointing margins if it relies heavily on expensive specialists or external contractors. Similarly, a project with realization below 100% may still be profitable if its fee adequately covers delivery costs.
The same principle applies to retainers.
A client may pay a consistent monthly fee while the effort required to fulfill service commitments varies significantly.
Realization can help compare fee value with recorded effort, but retainer performance also depends on resource cost, service usage, contract terms, and the expected profitability of future commitments. For these engagements, evaluate project profitability using actual and forecast revenue and costs, not realization alone.
How to Detect Realization Problems Before Invoicing
Realization becomes more valuable when organizations can identify the conditions that lead to write-downs, billing adjustments, or weak fee recovery while delivery decisions can still change the outcome.
A practical approach is to establish a recurring Capacity-to-Cash review. This framework examines four stages where expected financial value can change.
1. Is the work being recorded completely?
Begin by establishing whether time and activity records accurately reflect delivery.
Incomplete time capture can distort realization reporting because unrecorded work never enters the calculation. Compare scheduled assignments, recorded time, approved timesheets, and known client commitments.
The objective is not simply timesheet compliance. It is ensuring that delivery and finance teams have a reliable basis for evaluating the value and cost of work performed.
2. Is delivery effort putting the expected project margin at risk?
Next, compare actual and forecast delivery effort with the original assumptions behind the engagement.
Review planned versus actual hours, resource mix, scope changes, rework, estimated remaining effort, and forecast project margin. For example, a fixed-fee implementation may require substantially more specialist time than anticipated.
Even if the project is still meeting its milestones, its latest forecast may indicate that the agreed fee will no longer support the expected profit margin. At that point, leadership can evaluate changes to staffing, scope, or the delivery plan rather than discovering the problem during final billing.
Accurate project accounting and current delivery forecasts provide the financial context for those decisions.
RELATED: How to Calculate Project Profitability, Step by Step
3. Is the amount invoiced consistent with the agreement?
Compare contracted rates and fees, approved work, and actual invoice values. Identify discounts, write-downs, billing omissions, and rate exceptions.
The review should distinguish between adjustments authorized under the client agreement and changes resulting from unexpected delivery issues. It should also identify work completed but unbilled because of approval delays or billing schedules.
Work in progress may represent a timing difference rather than a permanent realization loss.
4. Is invoiced value being collected?
Finally, review the collection status of invoiced amounts. Separate invoices that are not yet due from overdue, disputed, or uncollectible balances.
Delayed payment can create cash-flow pressure without representing a permanent collection loss. However, recurring disputes may indicate problems with contract terms, invoice accuracy, scope approvals, or client expectations.
Following invoices through collection helps finance determine whether an apparent shortfall reflects timing or an actual reduction in recovered amounts.
The Capacity-to-Cash Review
The review should make exceptions visible by project, client, practice, and contract type.
A recurring problem with fixed-fee overruns requires different action from isolated invoice disputes or an increase in negotiated rate discounts.
The objective is to identify the responsible function, understand the financial impact, and intervene before the same problem affects additional engagements.
How to Report Realization Across Multiple Projects and Practices
Portfolio-level realization should be calculated using underlying financial values rather than a simple average of project percentages.
Consider two engagements:
- Project A has $20,000 of standard billable value and 60% billing realization.
- Project B has $400,000 of standard billable value and 92% billing realization.
A simple average produces a realization rate of 76%.
But the combined invoiced value is:
($20,000 × 60%) + ($400,000 × 92%) = $380,000
Against $420,000 in total standard billable value, the financially weighted realization rate is:
$380,000 ÷ $420,000 × 100 = 90.5%
That is a substantially different result.
For organizations managing multiple practices, regions, and client portfolios, weighted realization provides a more accurate view of aggregate billing performance.
However, the consolidated number should not replace engagement-level analysis.
Leadership also needs visibility into contract type, write-down causes, pricing exceptions, and changes in forecast margin.
Without that detail, a strong portfolio average can conceal recurring problems in a specific service line or client segment.
Why Doesn't High Realization Always Mean High Profitability?
Realization measures how effectively expected billable value becomes billed or collected value. Profitability measures the financial return after the relevant delivery costs.
A project can achieve excellent realization and still miss its margin target.
For example, a consulting engagement may invoice and collect its full contracted fee but require more senior specialists, contractors, or delivery hours than originally planned.
Those additional costs reduce profitability even when no revenue is written down.
The reverse can also occur. An engagement may realize less than its standard-rate value while still generating a healthy margin because delivery costs are controlled.
The relationship can be evaluated through four complementary measures:
Utilization → Realized billing value → Delivery cost → Project margin
These patterns provide a starting point, not a definitive diagnosis.
The underlying financial data should determine whether leaders need to change pricing assumptions, allocate scarce specialists differently, strengthen scope controls, or adjust future delivery commitments.
A declining realization rate may be the first visible sign of deteriorating engagement economics. But protecting project margin requires understanding both revenue performance and the cost of producing that revenue.
How Can Professional Services Software Support Realization Management?
For organizations managing dozens or hundreds of simultaneous engagements, the challenge is not calculating realization. It is connecting the information required to explain changes in performance and respond early enough to make a difference.
That requires consistent visibility into recorded work, approved rates, contract terms, project budgets, remaining effort, billing, and financial forecasts.
Accelo's project financials capabilities connect time and expense capture with project budgets, invoicing, profitability, and financial forecasting.
This information helps delivery and finance teams investigate changes in project economics before they become invoice adjustments or margin shortfalls.
For example, if a project forecast shows that an implementation will require substantially more specialist effort than estimated, the delivery leader can evaluate alternative staffing arrangements and remaining scope.
Finance can assess whether the additional effort is recoverable under the agreement and how it changes expected project revenue and margin.
Together, those decisions can prevent a delivery overrun from becoming an avoidable financial loss.
The benefit is not another standalone metric. It is greater confidence in how current delivery decisions will affect future financial performance.
“The level of financial reporting that we get from Accelo is far above anything that I’ve seen in any project management tool that I’ve ever used. And just having it all in one place, we have a much more accurate view of our margins and expenses and costs as they relate to our projects, which has been super beneficial to our business.” - Allison Escott, Director of Operations, Herman Scheer (United States)
Realization Rate Should Inform Better Financial Decisions
Realization rate is a useful indicator of how effectively professional services organizations convert the value of recorded work into invoiced or collected amounts. But the percentage alone cannot explain whether a business is pricing work appropriately, delivering efficiently, or protecting its margins.
That requires connecting realization with utilization, delivery costs, resource allocation, and forecast profitability.
When you can identify why expected billable value is changing, you can make better decisions about client agreements, specialist capacity, scope, and billing controls.
The objective is not to maximize realization in isolation. It is to ensure that the work being delivered produces the financial return the organization expects, and to identify what needs to change when it doesn't.
Frequently Asked Questions
Can realization rate exceed 100%?
Yes. Realization can exceed 100% when an engagement generates more invoiced value than the standard value of recorded work. This can occur on fixed-fee projects delivered with fewer hours than anticipated. However, realization above 100% does not necessarily indicate high profitability.
What is the difference between realization and revenue leakage?
Realization compares invoiced or collected value with the standard value of recorded billable work. Revenue leakage concerns revenue that should have been captured but was lost through operational, contractual, or billing failures. A realization shortfall may include intentional discounts or other agreed pricing differences, so the two measures should not be treated as equivalent.
Should realization be measured by employee or by project?
Both views can be useful. Employee-level reporting can reveal rate differences, billing adjustments, or time-capture patterns. Project-level reporting is generally better suited to investigating fixed-fee overruns, write-downs, scope changes, and delivery economics. Practice- and client-level reporting helps identify recurring patterns across engagements.