
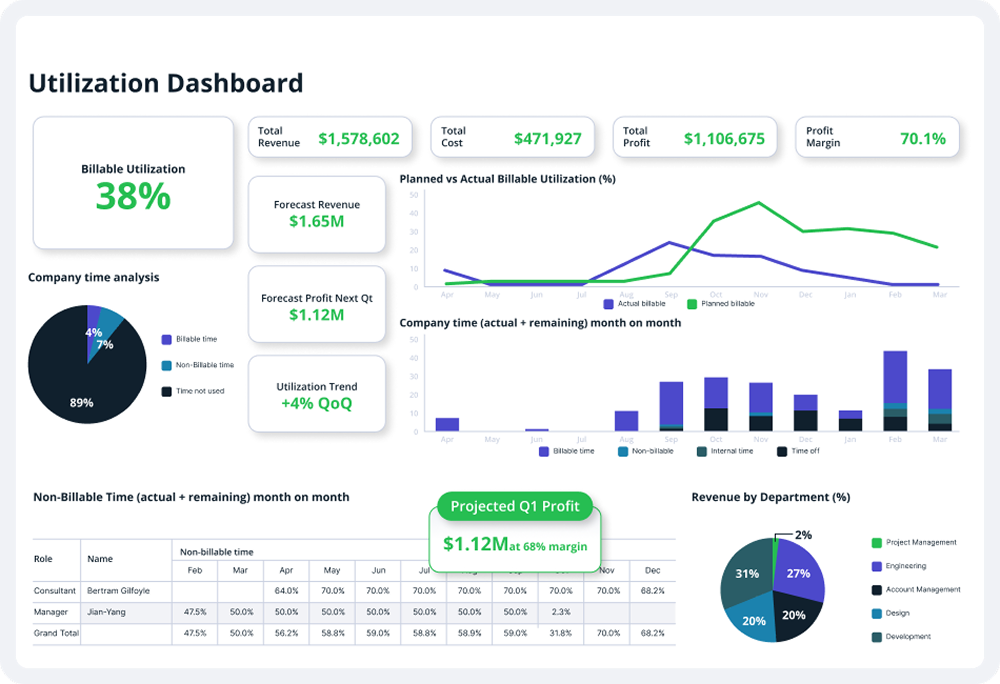


See where you stand and where to improve; compare your company’s performance against professional services firms like yours.
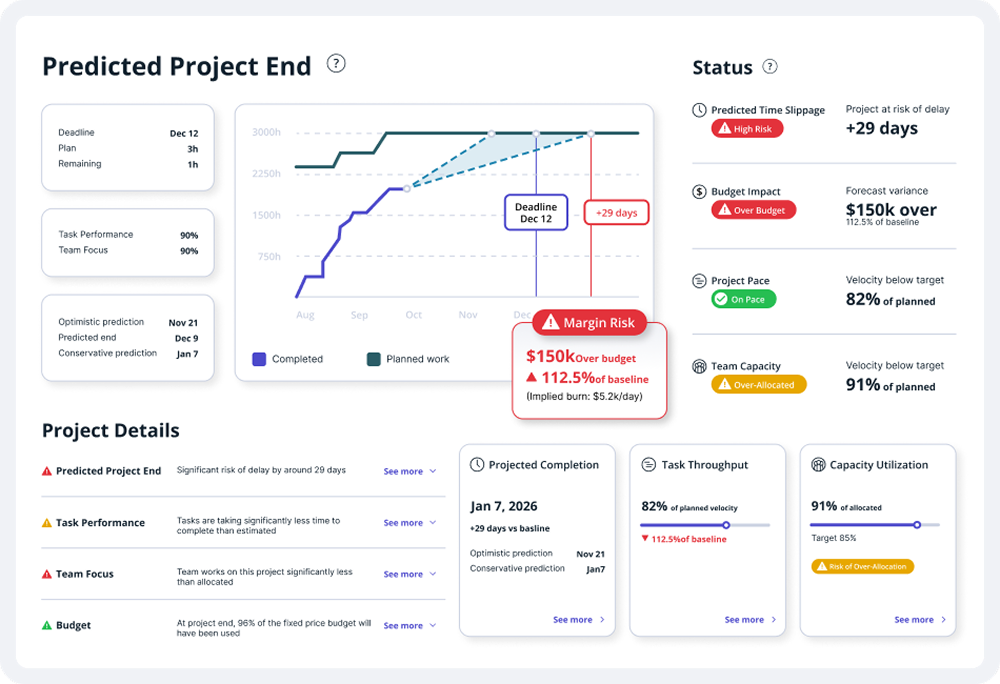
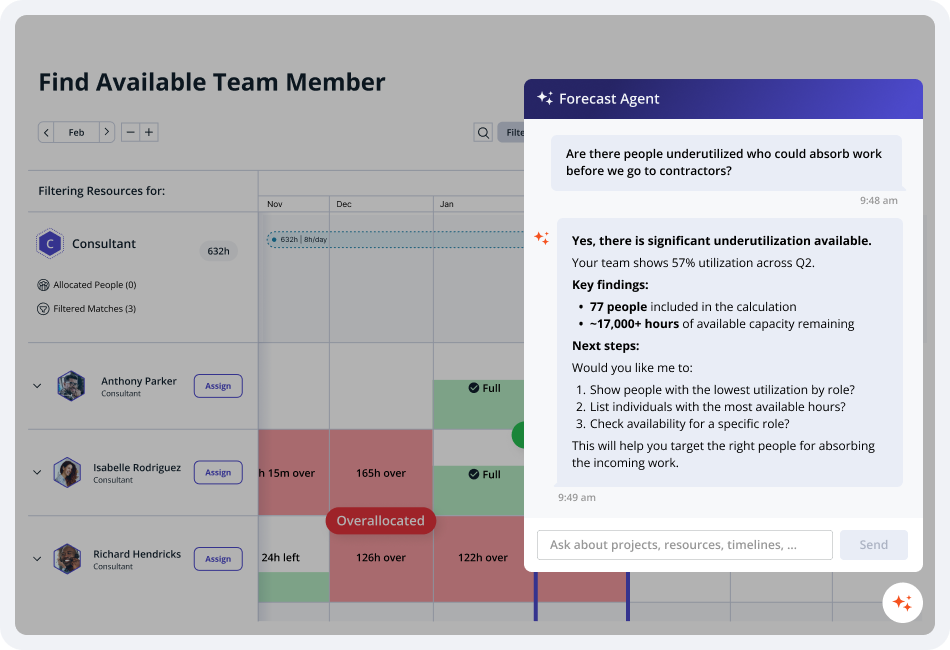
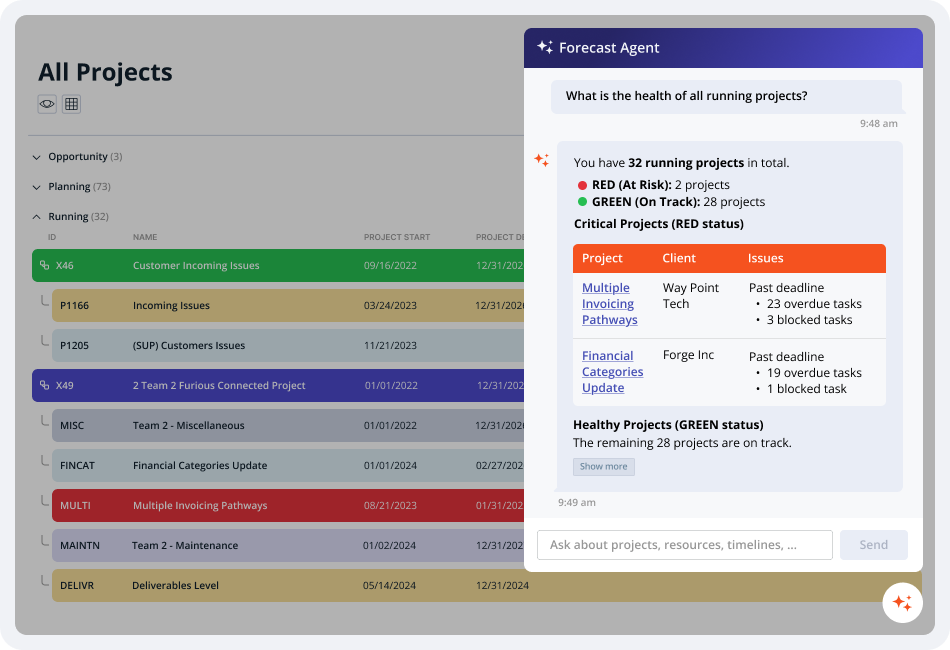
See how Accelo’s AI-powered project performance metrics help you uncover growth opportunities, identify emerging risks, and course-correct to keep profitability on track.
.svg)