Utilization Dashboard (Premium)
Never be in the dark on how utilized your team members are in the past and in real-time by using the Utilization Dashboard.
Note: This feature is available for Premium Licenses only.
Using this guide, you can:
- Understand the purpose of the Utilization Dashboard
- Understand where the data is coming from
- Use Filtering Options
- Export your Dashboard
The Purpose of the Utilization Dashboard
Our Utilization Dashboard allows users of Premium accounts to monitor their team’s productivity through billable and non-billable time. This dashboard is a great way to analyze data over periods of time in the recent past and long-term.
Navigate to the Utilization Dashboard by navigating to the Left Hand Side Menu, clicking Reports, and selecting the Utilization Dashboard.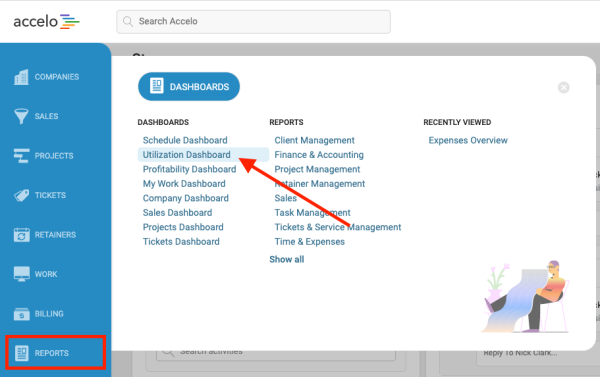
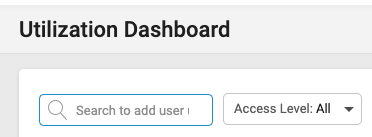
To start, you can search to add specific users on the top left.
Once you add the appropriate users to the Dashboard, you will be able to view how they are being utilized in the platform through a bar graph of their time logged and scheduled. You will see this graph displayed as a bar for each week, with seven weeks viewed at a time.

Where is this data from?
This data stems from any logged time on our platform - whether billable or non-billable, as well as estimated time scheduled to the user.
This time is separated and able to filtered through:
-
Logged Time:
-
Billable: Any time that was logged that is directly billable to a client.
-
Non-billable: Any time that was logged that is not billable to the client.
-
-
Estimated Time:
-
Scheduled: This logged time was scheduled for a particular time period (1-2 pm).
-
External: These times are coming from your external calendar (Google Calendar, Outlook).
-
Committed: These logged times are not for a specific time, but for a committed block of time.
-
Auto-scheduled: This is the predicted amount of work that is upcoming over the next few weeks. You can then see the time already predicted to be allocated during the current week and any future weeks.
-
These graphs are in relation to the number of weekly hours you have put in your user preferences. This allows you to follow part-time employees and other staff members that do not work the average of 40 hours of week.
Additional Filtering Options
-
Date: You can filter through a set of rules around different date ranges. Either use the arrows on either side of the graph to scan through different weeks in the past or future, or click on the dates to select a specific date range.
-
Access Level: You can follow groups of users of different access levels.

-
Divisions: If you have multiple divisions set up for different locations, you can track profitability by different divisions.

-
Groups: If want to filter by different groups, you can do so as well. An example would be the "Project Managers" group vs the "Design" group.

-
Manager: Filter your users by different managers.

-
Skills: Filter your users by their different skillsets.

Exporting your Results
There can be a lot of information on the Utilization Dashboard, and you may want to share it with your team or summarize it through another tool. You can achieve this easily by exporting your Dashboard, which is an option available on the top right-hand side pictured below.

Exporting your data will give you a spreadsheet in .xls format which will hold the following information:
-
User - The Staff or User
-
Total Availability - Your total work availability that has no work scheduled, within your date range.
-
Total Hours Logged - The total number of hours logged within your date range.
-
Billable Hours Logged - The total number of billable hours logged within your date range.
-
Non Billable Hours Logged - The total number of non-billable hours logged within your date range.
-
Total Utilization Percentage - A percentage of your Total Hours Logged vs your Total Availability
-
Billable Percentage - A percentage of your Billable Hours Logged vs your Total Hours Logged
-
Non Billable Percentage - A percentage of your Non Billable Hours Logged vs your Total Hours Logged
-
Auto Scheduled Hours - Hours that were auto scheduled from your Tasks, based on your remaining work and dates.
-
Committed Hours - Hours that were formally committed from the Team Scheduling page.
-
Scheduled Hours - Hours that were formally scheduled from the Team Scheduling page.
-
External Hours - Number of hours synced in from your Calendar outside of Accelo that has yet to be directly logged under any work in Accelo.